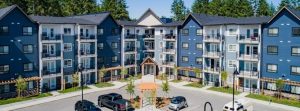
Bluestone Nanaimo has achieved LEED® BD+C Gold certification
BRITISH COLUMBIA – Starlight Western Canada Multi-Family (No. 2) Fund announced its results of operations and financial condition for the three months ended September 30, 2022 and nine months ended September 30, 2022, which includes 220 days of operating activity following the closing of the Fund’s initial public offering on February 22, 2022 through September 30, 2022.
All amounts in this press release are in thousands of Canadian dollars except for average monthly rent (“AMR”)1 or unless otherwise stated.
ACQUISITION AND LIQUIDITY HIGHLIGHTS
- Subsequent to the Offering, on February 23, 2022, the Fund completed the acquisition of five properties in Nanaimo, Langford and Vernon, which included a total of 495 multi-family suites located on Vancouver Island and the mainland of the Province of British Columbia.
- On March 1, 2022, June 7, 2022 and August 29, 2022, the Fund acquired its sixth, seventh and eighth properties, adding 166, 57 and 120 multi-family suites in Langford, Langley and Nanaimo, British Columbia, respectively.
- As at September 30, 2022, the Fund had approximately $31,604 of available liquidity, which included cash remaining from the Offering to be used primarily to acquire additional multifamily properties.
Q3-2022 HIGHLIGHTS
- The Fund achieved a 15.0 per cent annualized increase in AMR during Q3-2022 with strong rent growth continuing to be driven by the demand for multi-family suites due to the economic strength in Canada and the Primary Markets.
- Revenue from property operations for Q3-2022 was $4,121, representing an increase of $1,380 or 50.3 per cent compared to the financial forecast included in the Fund’s prospectus dated January 27, 2022, primarily as a result of the Non-Forecast Properties not being included in the Forecast. For the Initial Properties, revenue was in line with the Forecast, primarily as a result of higher than forecasted AMR and ancillary income, partially offset by lower than forecasted occupancy.
- Total portfolio net operating income (NOI)1 for Q3-2022 was $3,067, representing an increase of $1,120 or 57.5 per cent compared to the Forecast, primarily as a result of the NonForecast Properties not being included in the Forecast. For the Initial Properties, NOI was $55 or 2.8 per cent higher than the Forecast primarily driven by lower than forecasted property taxes, partially offset by higher than forecasted property operating costs.
“We are pleased to announce the Fund’s strong third quarter operating performance with net operating income above the Fund’s forecast,” commented Daniel Drimmer, the Fund’s Chief Executive Officer. “The Fund continues to focus on optimizing operating results for its existing portfolio while deploying the remaining proceeds from its initial public offering by actively pursuing acquisition opportunities in the Fund’s target markets to complement its existing portfolio.”
- As at November 15, 2022, the Fund had collected approximately 98.7 per cent of rents for Q3-2022, with further amounts expected to be collected in future periods, demonstrating the Fund’s strong resident base and operating performance.
- Net loss and comprehensive loss attributable to unitholders of the Fund (“Unitholders”) for Q3-2022 was $702, representing a decline of $799 relative to the Forecast primarily as a result of increased finance costs and higher distributions to Unitholders due to the Fund electing to pay a 3.1 per cent annualized distribution despite all of the Offering not yet being fully deployed. Net loss and comprehensive loss attributable to Unitholders would have been $381 for Q3-2022, assuming the Fund had paid distributions based on actual equity deployed.
- Adjusted funds from operations (“AFFO”)1 for Q3-2022 was $531, representing a decrease of $261 or 33 per cent relative to the Forecast primarily due to higher than forecasted finance costs and fund and trust expenses attributable to the Non-Forecast Properties not being included in the Forecast, partially offset by higher than forecasted NOI due to Non-Forecast Properties not being included in the Forecast.
See full report here.


