 BRITISH COLUMBIA – According to the British Columbia Real Estate Association (BCREA) 2022 Third Quarter Housing Forecast Update, high mortgage rates are predicted to weigh on housing activity throughout 2023.
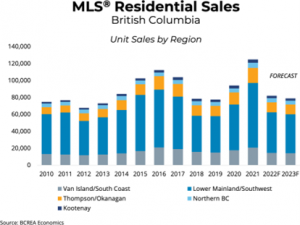
Multiple Listing Service (MLS) residential sales in BC are forecast to decline 34.4 per cent from a record high 2021 to 81,900 units this year. In 2023, MLS residential sales are forecast to fall an additional 5 per cent to 77,790 units.
“Mortgage rates have risen at a much faster rate and to a higher level than previously anticipated,” said BCREA Chief Economist Brendon Ogmundson. “Faced with a dramatic shift in the cost of borrowing, housing market activity is likely to fall well below normal over the next year.”
Weaker sales and rising inventory mean that some regions, largely in more expensive markets, have tipped into buyers’ market territory. Consequently, average MLS home prices have come down from peak levels.
While the housing market is currently feeling the weight of higher interest rates, the downturn is unlikely to be long-lived as BC’s strong population growth combined with extremely favourable demographics means there will be no shortage of demand for housing in the province.
| Unit Sales | Average MLS® Price ($) | |||||
| Board Area | 2021 | 2022F | 2023F | 2021 | 2022F | 2023F |
| Victoria | 9,514 | 6,500 | 6,400 | 906,404 | 992,300 | 970,000 |
| 18.0% | -31.7% | -1.5% | 16.5% | 9.5% | -2.2% | |
| Vancouver Island | 10,730 | 7,500 | 7,300 | 664,149 | 768,500 | 750,000 |
| 18.5% | -30.1% | -2.7% | 25.1% | 15.7% | -2.4% | |
| Powell River Sunshine Coast | 431 | 400 | 390 | 519,928 | 682,300 | 675,000 |
| 3.6% | -7.2% | -2.5% | 23.6% | 31.2% | -1.1% | |
| Greater Vancouver | 44,884 | 30,000 | 28,500 | 1,188,693 | 1,225,000 | 1,190,000 |
| 42.0% | -33.2% | -5.0% | 11.5% | 3.1% | -2.9% | |
| Fraser Valley | 26,546 | 15,500 | 14,000 | 1,013,855 | 1,030,000 | 990,000 |
| 40.7% | -41.6% | -9.7% | 22.7% | 1.6% | -3.9% | |
| Chilliwack and District | 4,799 | 2,500 | 2,400 | 728,146 | 789,200 | 750,000 |
| 37.3% | -47.9% | -4.0% | 26.2% | 8.4% | -5.0% | |
| Interior:
Okanagan* |
14,202 |
9,100 |
9,000 |
701,416 |
775,000 |
750,000 |
| 25.0% | -35.9% | -1.1% | 19.6% | 10.5% | -3.2% | |
| Kamloops and District | 3,746 | 2,700 | 2,500 | 559,595 | 652,000 | 650,000 |
| 23.1% | -27.9% | -7.4% | 22.0% | 16.5% | -0.3% | |
| Kootenay | 3,992 | 3,000 | 2,800 | 450,466 | 515,000 | 510,000 |
| 14.7% | -24.8% | -6.7% | 17.3% | 14.3% | -1.0% | |
| South Peace River** | 538 | 600 | 500 | 284,524 | 290,000 | 280,000 |
| 62.0% | 11.5% | -16.7% | 10.2% | 1.9% | -3.4% | |
| BC Northern | 5,495 | 4,100 | 4,000 | 384,661 | 411,500 | 405,000 |
| 28.6% | -25.4% | -2.4% | 15.5% | 7.0% | -1.6% | |
| BC Total | 124,877 | 81,900 | 77,790 | 927,779 | 969,400 | 939,500 |
| 32.8% | -34.4% | -5.0% | 18.7% | 4.5% | -3.1% | |
*NOTES: The Okanagan Mainline Real Estate Board (OMREB) amalgamated with the South Okanagan Real Estate Board (SOREB) on January 1, 2021, to form the Association of Interior REALTORS©. In February 2022, the Association merged with the Kootenay and Kamloops real estate boards.
**The former Northern Lights Board, which was merged with SOREB in 2011, will now be called the South Peach River Region and is part of the new Association of Interior Realtors.
@bcrea