@bcnreb.bc.ca
PRINCE GEORGE – The BC Northern Real Estate Board (BCNREB) indicators estimate the proportion of median household income required to cover the major costs of home ownership, including mortgage payments, municipal taxes, fees, and utilities for an average single-family home. The higher the percentage, the more difficult a home is to afford. For instance, a measure of 30% signifies that these costs consume 30% of a typical household’s pre-tax annual income.
This edition incorporates minor adjustments to 2023 and 2024 figures based on newly available 2023 Utilities Cost data. Additionally, revisions to 2024 sales data for Fort St. John have been applied, affecting both local and weighted Northern BC calculations.
It is worth noting that the HAI is a snapshot of housing affordability for a given year based on best available data. Because reliable community-based income data is only sourced from the Census taken every 5 years income growth indicators often lag by two years.Consequently, immediate economic shifts, such as forest sector curtailments, may not be fully captured in the year they occur. Nevertheless, the HAI remains a robust and reasonable measure of comparative housing affordability.
Affordability by Community
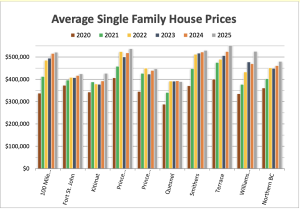
Affordability improved in 2025 for nearly all measured northern BC communities. Williams Lake and Kitimat were the only exceptions, showing a noteworthy decline in affordability driven by the region’s highest house price increases (11.7% and 8.6%, respectively).
Despite these price increases, Kitimat (25.3%) remains one of the two most affordable communities in Northern BC for 2025, bested only by Fort St. John (25.1%).
Source: BCNREB