OTTAWA – Following a weak second half of 2023, home sales over the last two months are showing signs of recovery, according to the latest data from the Canadian Real Estate Association (CREA).
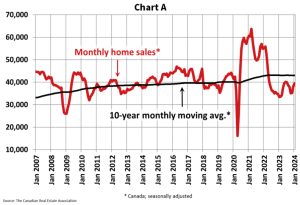
 Home sales activity recorded over Canadian MLS® Systems rose 3.7% between December 2023 and January 2024, building on the 7.9% month-over-month increase recorded the month prior. While activity is now back on par with 2023’s relatively stronger months recorded over the spring and summer, it begins 2024 about 9% below the 10-year average. (Chart A)
“Sales are up, market conditions have tightened quite a bit, and there has been anecdotal evidence of renewed competition among buyers; however, in areas where sales have shot up most over the last two months, prices are still trending lower. Taken together, these trends suggest a market that is starting to turn a corner but is still working through the weakness of the last two years,” said Shaun Cathcart, CREA’s Senior Economist.
National gains were once again led by the Greater Toronto Area (GTA), along with Hamilton-Burlington, Montreal, Greater Vancouver and the Fraser Valley, Calgary, and most markets in Ontario’s Greater Golden Horseshoe and cottage country.
The actual (not seasonally adjusted) number of transactions came in 22% above January 2023, the largest year-over-year gain since May 2021. That said, with current activity still running at below-average levels, the double-digit gain was more reflective of the base effect from the comparison to January 2023, which was the worst start to almost any year in the past two decades.
The number of newly listed homes edged up 1.5% on a month-over-month basis in January, although it remains close to the lowest level since last June.
“The market has been showing some early signs of life over the last couple of months, probably no surprise given how much pent-up demand is out there,” said Larry Cerqua, Chair of CREA. “There’s a consensus that the market will probably look quite a bit different this year compared to 2022 and 2023.
With sales up by more than new listings in January, the national sales-to-new listings ratio tightened further to 58.8% compared to under 50% just three months earlier. The long-term average for the national sales-to-new listings ratio is 55%. A sales-to-new listings ratio between 45% and 65% is generally consistent with balanced housing market conditions, with readings above and below this range indicating sellers’ and buyers’ markets respectively.
There were 3.7 months of inventory on a national basis at the end of January 2024, down from 3.8 months at the end of December and 4.1 months at the end of November. The long-term average is about five months of inventory.
The Aggregate Composite MLS® Home Price Index (HPI) fell by 1.2% on a month-over-month basis in January 2024. This represented an acceleration from the 1.1% decline recorded in December.
Price declines of late have been predominantly located in Ontario markets, particularly the Greater Golden Horseshoe and, to a lesser extent, British Columbia. Elsewhere in Canada prices are mostly holding firm or in some cases (Alberta and Newfoundland and Labrador) continuing to climb.
The Aggregate Composite MLS® HPI was up 0.4% on a year-over-year basis in January 2024, little changed from readings over the last six months (0.4% – 1.1%).
The actual (not seasonally adjusted) national average home price was $659,395 in January 2024, up 7.6% from January 2023.
Source: crea.ca


