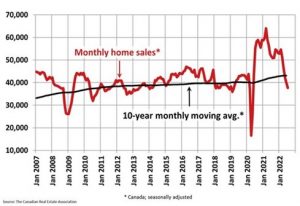
Monthly home sales (Canadian Real Estate Association)
OTTAWA – Home sales recorded over Canadian MLS® Systems fell by 5.3 per cent between June and July 2022. While this was the fifth consecutive month-over-month decline in housing activity, it was also the smallest of the five.
Sales were down in about three-quarters of all local markets, led by the Greater Toronto Area (GTA), Greater Vancouver and the Fraser Valley, Calgary and Edmonton.
The actual (not seasonally adjusted) number of transactions in July 2022 came in 29.3 per cent below that same month last year.
“July saw a continuation of the trends we’ve been watching unfold for a few months now; sales winding down and prices easing in some relatively more expensive parts of the country as well as places where prices rose most over the past two years,” said Jill Oudil, Chair of CREA. “That said, the demand that was so strong just a few months ago has not gone away, but some buyers will likely stay on the sidelines until they see what happens with borrowing costs and prices. As they re-enter the market, they’ll find a bit more selection, but not as much as might be expected. As the market continues to evolve, your best bet is to contact your local realtor for information and guidance about how to navigate the current environment,” continued Oudil.
“One new piece of the puzzle was the decline in new listings in July. It was of the same magnitude as the decline in sales, and in many of the same parts of the country,” said Shaun Cathcart, CREA’s Senior Economist. “It’s only one month of data at this point but it suggests that some sellers are also playing the waiting game, and that is with an overall inventory of homes for sale that is still historically low. The Bank of Canada is also expected to finish up their remaining rate hikes (100 basis points or so) over the next few months, which five-year fixed mortgage rates have mostly already priced in. We’ve already witnessed a sharp housing market adjustment this year, but it will hopefully be short-lived if conditions continue to show signs of stabilizing,” said Cathcart.
The number of newly listed homes fell back by 5.3 per cent on a month-over-month basis in July. The decline in new supply was broad-based, with listings decreasing in about three-quarters of local markets, including most large markets.
With sales and new listings both down by 5.3 per cent in July, the sales-to-new listings ratio remained unchanged at 51.7 per cent — slightly below the long-term average for the national sales-to-new listings ratio of 55.1 per cent.
There were 3.4 months of inventory on a national basis at the end of July 2022, still historically low but up quite a bit from the all-time low of 1.7 months set at the beginning of 2022.
The Aggregate Composite MLS® Home Price Index (HPI) edged down 1.7 per cent on a month-over-month basis in July 2022. This was similar to but less than the 1.9 per cent decline recorded in June.
Regionally, most of the monthly declines in recent months have been in markets across Ontario and, to lesser extent, in British Columbia.
Prices continue to be more or less flat across the Prairies while only just now showing small signs of dipping in Quebec. On the East Coast, prices are mostly continuing to rise, albeit at a much slower pace. The exception is relatively more expensive Halifax-Dartmouth, where prices have dipped slightly.
The non-seasonally adjusted Aggregate Composite MLS® HPI was still up by 10.9 per cent on a year-over-year basis in July; although, those year-over-year comparisons have been winding down pretty quickly from the near-30 per cent record year-over-year increases logged in January and February.
The actual (not seasonally adjusted) national average home price was $629,971 in July 2022, down 5 per cent from the same month last year. The national average price is heavily influenced by sales in Greater Vancouver and the GTA, two of Canada’s most active and expensive housing markets. Excluding these two markets from the calculation cuts $104,000 from the national average price.
Just as these two markets impact the national average, market conditions can also skew the measure. For example, rapidly rising borrowing costs disproportionally curb sales in more expensive markets and market segments. This can result in a statistical phenomenon known as Simpson’s Paradox, where the change in the composition of national sales can cause the national average price to overstate the downward pressure on actual prices. This explains how the national average price is down 5 per cent year-over-year in July despite average prices being down just 0.4 per cent in Ontario and still up in every other province.
@crea.ca

